Whether paid out as dividends to shareholders or retained by a business, a share’s worth is the current value of the cash it will generate in the future.
We hear financial strategists suggesting that a company should be valued by creating a complicated discounted cash flow valuation.
However, there are some drawbacks to this approach and I’d suggest staying with a few simple valuation tools as an alternative.
One of the tools we can use is the price-to-earnings ratio or PER (also known as P/E ratio). This is the most often used tool to value companies. As with any tool, we should always look at the P/E ratio as a way to achieve an estimate of the current value of a company’s future cash flow.
NOTE: This is a follow-up to the previous post How Do You Know How Expensive A Stock Is? Use The P/E Ratio. There, I explained the basics of the P/E ratio and what it’s good and not good for. If you’re new to the concept, this is a great place to start. If you’ve already gone through that, then continue on 🙂
Defining ‘Profit’
When we say that a company is making a profit, we mean that its annual cash receipts exceed its expenses. The company can then keep the profit and decide to either distribute it to shareholders in the form of dividends or it can reinvest it in the business.
When valuing a business, we can view the reinvested profit in one of two ways.
It may be seen as cash that is currently have available (and is simply being reinvested in the company), or it can be looked at as extra cash that will be earned in the future because it was reinvested today.
So, which approach is the better one? The truth is, it really doesn’t matter which one we take. Whether we reinvest our profit in one company or another, we are making the assumption that our capital will generate the same return in either case.
How P/E Ratio Gives You A ‘Shortcut’ to Valuation
Having an understanding of profit gives us a simple short cut to valuation.
We can begin thinking of this current year’s profit (or earnings if the profit is after taxes are paid) as repeating every year going forward, rather than discounting and adding a series of varying cash flows.
This makes valuation much simpler because the value of the same amount of profit repeating over and over is reduced to that amount divided by the return we are seeking to make.
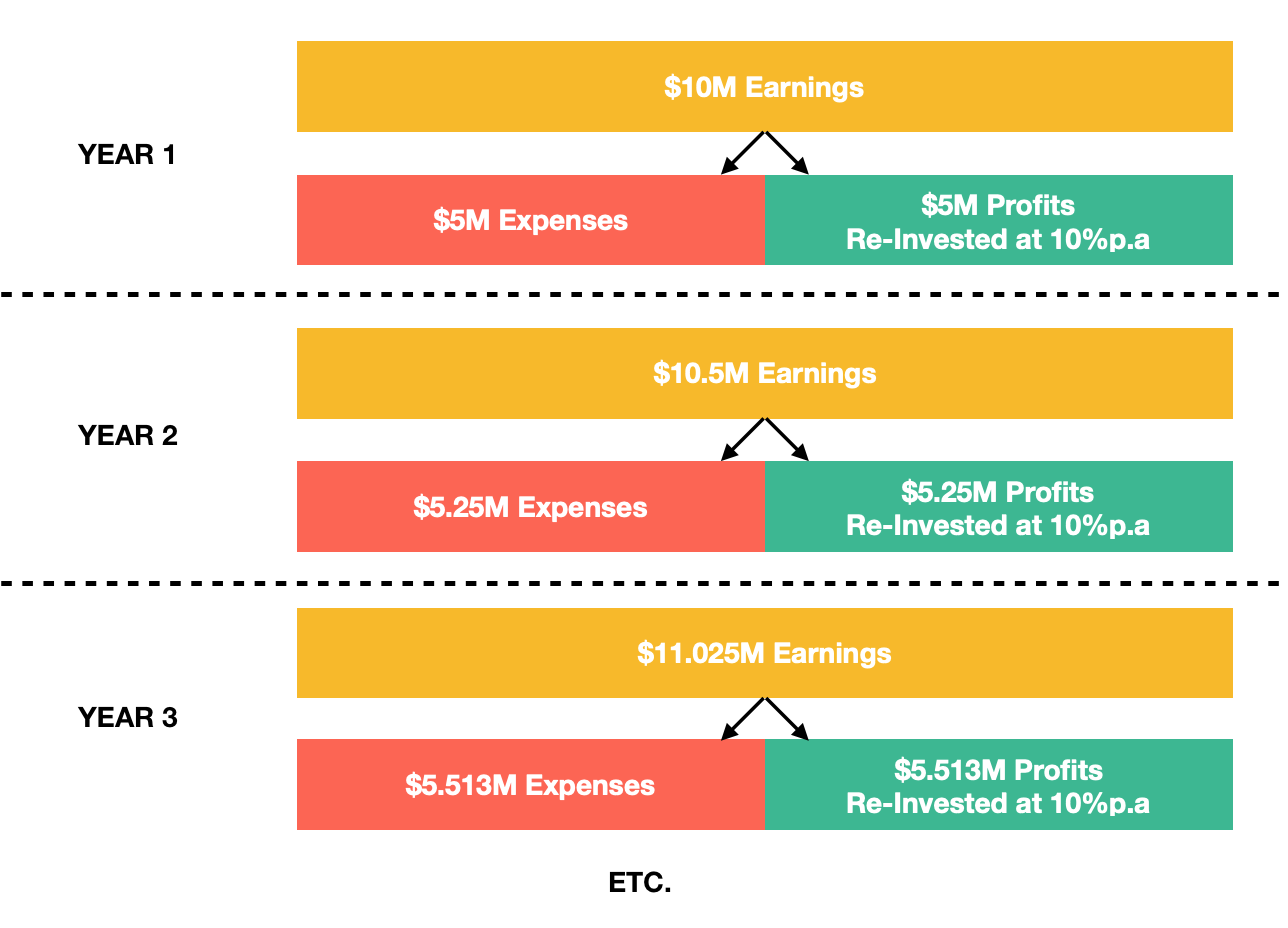
To illustrate this, let’s imagine that our goal is to make a return of 10% annually and we have a company that also makes a return of 10%. This company’s policy is to retain half of its earnings to reinvest in the company and the remaining half is paid out to its shareholders.
Now let’s say that this year, the company earns $10m, pays out $5m in expenses and reinvests its profit of $5m.

Next year, it will make $10.5m (the same $10m plus 10% on the $5m reinvested) and pay out $5.25m. Then, the year after that, it will make $11.025m and pay out $5.513m.
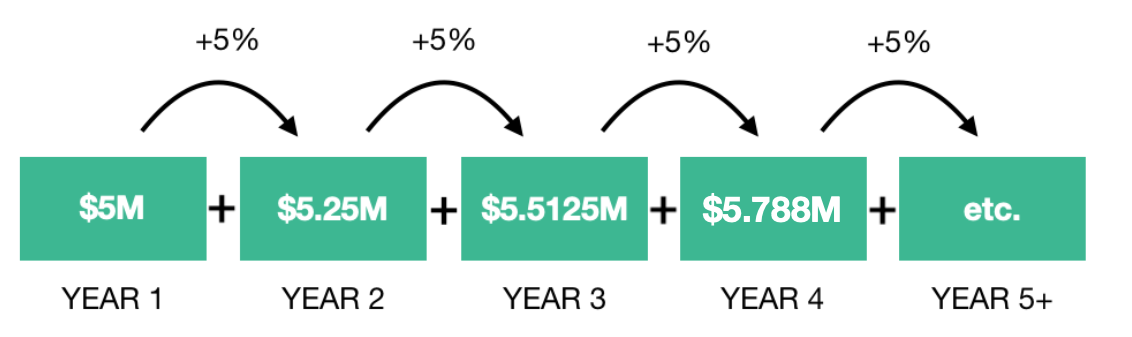
In other words, there will be a series of cash flows beginning at $5m and then growing 5% annually forever.
If we were to do it the long way, we could spend our time discounting each cash flow at 10% annually and then total them. After all of our work we would find that the total value would come to $100m. 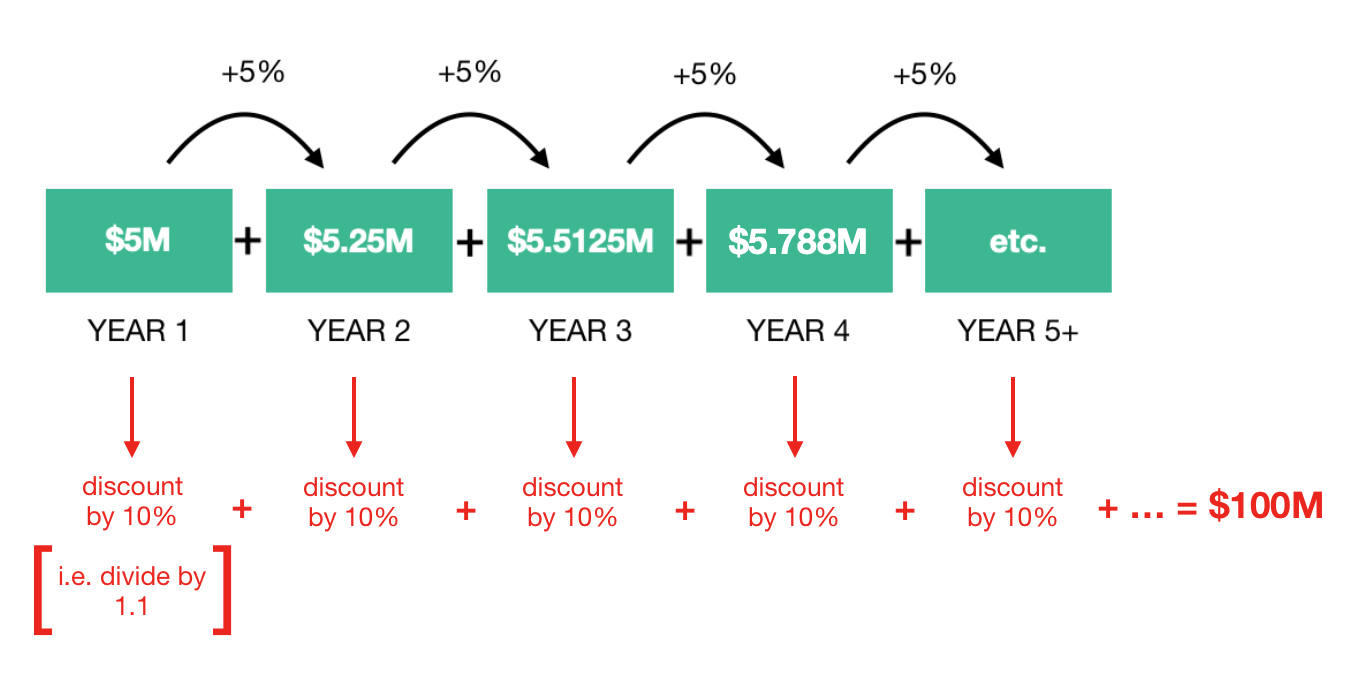 Of course, we could also try the short cut, divide the current year’s earnings by our goal of a 10% return and find out that the total value would come to the same $100m.
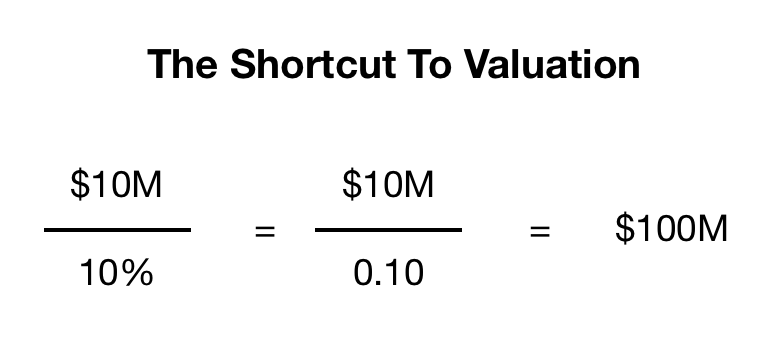
I don’t know about you, but I have other things I can do with my time than spending it discounting and totalling cash flows.
This is the foundation of the price-to-earnings ratio.
Instead of dividing our earnings by our targeted return, we multiply them by the reciprocal of that return. What we get in the end is exactly the same.
No matter what our goal is for returns and regardless of how much of its earnings is reinvested by a company, its value comes down to the current year’s earnings divided by the return we are seeking to achieve.
Using The Price-To-Earnings-Ratio As A Reference Guide: An Example
As a final example, let’s say we are seeking an annual return of 8%. We would therefore pay a PER of 12.5 (1 divided by 8%).
If our goal is an annual return of 12%, then we’d pay a PER of 8.33.
Regardless of which level we go with, we will call this our ‘reference P/E ratio’.
Theory v. Practice
In reality, theory and practice don’t always match.
We know that some companies reinvest and have consistently poor returns while others have better than average returns.
Then there are some companies that have such varying returns that it becomes extremely difficult to get a good sense of their underlying earnings.
High Quality Companies
The highest quality companies have a lot of room to reinvest large percentages of their earnings and at high rates of return.
These companies may be fair value at significant premiums to your reference P/E ratio.
Another way to say this is that if you could buy them at around your reference P/E ratio, then their superior rates of return might provide you with a margin of safety.
Middle Quality Companies
Then then we have companies that fall in the middle.
The returns they make on their reinvested earnings are close to the returns we are seeking to achieve or they pay out all of their earnings.
If we stayed around our reference P/E ratio, a company in this middle range would be of fair value.
However, we would have to pay less in order to get a margin of safety.
Bottom-Of-The-Barrel Companies
Finally, we have those companies and the bottom of the barrel. Companies in this category hold on to their capital and their returns are poor.
We have to be very cautious about companies like this because they will be overvalued even when there are very low PERs and they can draw us in if we are not careful.
The Bottom Line
Honestly, the P/E ratio is not the best tool to use when valuing companies in this category. As an alternative, I would suggest looking at the assets and thinking about whether there is a better use of capital.
There’s no doubt that the PER is a helpful tool, but we can’t use it as our only tool. We should always look at the quality of the company before making a decision.
Terry